Tunnelling in Germany: Statistics (2024/2025),Analysis and Outlook
 Credit/Quelle: STUVA

 Credit/Quelle: DB InfraGo AG/Arnim Kilgus
 Credit/Quelle: STUVA

 Credit/Quelle: STUVA


 Credit/Quelle: STUVA
 Credit/Quelle: STUVA
 Credit/Quelle: STUVA
 Credit/Quelle: STUVA
 Credit/Quelle: STUVA
Tunnel construction activities in Germany at the turn of 2024/25 comprise 40 transport tunnel projects with a total length of around 83 km, thus stagnating at a historically low level. At the time of reporting, the volume of planned transport tunnels amounts to 156 individual projects with a total length of 659 km.
1 Tunnels Under Construction
STUVA has been keeping statistics on tunnelling in Germany for more than 45 years. Based on an annual survey of clients, construction companies and designers, the data is regularly published in consolidated form. The motivation for this was and is a corresponding suggestion by the International Tunnelling and Underground Space Association [1]. The outcome is compiled in tabular form for the month of December 2024 and subsequently assessed. The table follows up its predecessors published for the years 1978 [2] to 2024 [3]. Only tunnels and drain/sewer structures which possess an accessible (walk-in or crawl-in) excavated cross-section, i.e. a clear minimum diameter of 1000 mm or, including the pipe wall, a minimum cross-section of roughly 1 m², are listed. As in previous years, small trenchless headings, which have been executed in conjunction with main drain construction, the relevant domestic connections and also pipe-jacking operations beneath rail and road facilities, are not included.
The tables for the tunnel projects under construction at the turn of the year 2024/25 are not listed in detail on account of their extent; however, data can be obtained from STUVA’s internet pages [4]. In these tables, the numbering of the tunnel projects indicates the relationship to the data material originating from previous years. Essentially it takes the form of single or double identification letters, a two-digit sequential registration number and a two-digit annual identification number. The identification letters serve to provide a brief assessment of the planned tunnel utilisation, namely:
US Light rail and metro tunnels
B Main-line rail tunnels
S Road tunnels
V Line and other supply tunnels
A Drain/sewer tunnels
So Miscellaneous tunnels
GS Tunnel modernisation
The identification number US 0124 therefore refers to a tunnel project with the sequential number 1 from the underground, urban and rapid transit tunnels sector, which was included for the first time in the statistics in 2024. The above-mentioned method of identification was selected against the background that the majority of construction sites, especially those from the transportation tunnel sector, run for two or three years or even more. This method of registration has proved itself in order to avoid projects being counted twice and to identify the new construction volume that has to be included. Accordingly, Table 1 shows not only the total construction volume but also, in brackets, the construction volume
newly recorded in the year under review. In addition to the details for the turn of the year 2024/25, the figures from the two previous years can also be found there for comparison.
By and large, the tunnel lists on the STUVA internet pages [4] provide information on the location and ultimate use of the tunnels surveyed, their lengths and cross-sections, and also the soil conditions mainly encountered. The construction method used is explained in brief and the scheduled construction time stated. As far as possible, the clients, designers and contractors are named. Details of constructional or technical aspects of a special nature are also provided for many projects.
When comparing transportation tunnels with supply and disposal tunnels, information on the excavated volumes of the individual schemes makes it possible to estimate the actual extent of the relevant measures in a better manner than mere details relating to lengths. However, the following should be observed when comparing the excavated volume: whereas the excavated volumes for underground construction measures can be determined with certainty, the comparative value for cut-and-cover methods can only be obtained by subtracting the amount of soil required for refilling from the total excavated volume.
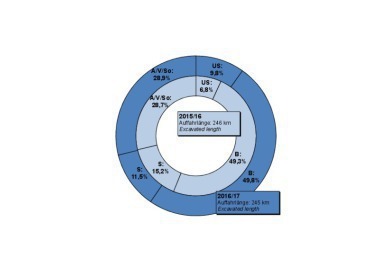
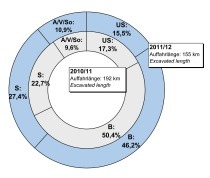
Table 1 provides a picture of the overall tunnelling length under construction at the end of the year in question and the related construction volume. For the turn of the year 2024/25, Figure 1 contains the driven length and the excavated volume in accordance with the type of tunnel utilisation shown in graphic form.
A general comparison of the figures in Table 1 shows that, with a total of just over 83 km (previous year: just over 84 km), construction activity in the area of transport tunnels remained virtually unchanged. While construction activity for tunnels for regional and main-line railways is picking up somewhat, tunnel construction
activity in the road transport sector is declining accordingly. Looking at the data on excavated volume, a comparison between transport tunnels on the one hand and supply and disposal tunnels on the other shows a volume ratio of around 11 : 1 with a length-related ratio of 2 : 1 (see Fig. 1).
The question of the completeness of the data obtained from the STUVA survey from contractors and consultants is difficult to assess. In order to ensure greater reliability in this respect, the 2024/25 survey, as in previous years, again contacted the cities engaged in underground, urban and rapid transit construction activities, and also DB InfraGO AG. The Federal Ministry for Transport (BMV) provided data for federal trunk road tunnels [5]. Such data is indispensable for the updating of these statistics and provides important additions and corrections. At this point, a special word of thanks goes to the Federal Ministry for Transport, Deutsche Bahn AG, the other authorities and clients mentioned, and the planners and contractors involved, for their assistance in compiling these statistics for tunnelling projects.
In the following, the results of the survey as of December 2024 are evaluated more thoroughly in various ways in order to obtain an up-to-date overview of tunnelling in Germany.
As in the previous year, the focus of inner-urban rail tunnelling (table section US) is in Munich, where a total of almost 22 km of urban and underground railway tunnels were under construction at the turn of 2024/25. It should be noted that preparatory construction measures are still ongoing for the 2nd S-Bahn Main Line and that tunnelling had not yet begun at the time of the survey. This is followed by the cities of Hamburg (8.9 km) and Nuremberg (2.5 km). Further tunnel sections, each less than 2 km in length, are under construction in Frankfurt am Main, Düsseldorf and Stuttgart.
The length-related proportion of underground construction methods with regard to inner-urban railway tunnel construction amounted to 26.2 km at the end of 2024, representing around 72% of the total nationwide construction volume for inner-urban railway tunnel construction. Again in relation to the total volume, sprayed concreting methods accounted for a good 7% (previous year: 8%) and shield driving for around 65% (previous year: 67%). Figure 3a provides an overview of the proportions of the various tunnel construction methods. In addition, the diagram in Figure 4a illustrates the length-related proportion of the various construction methods in underground, urban and suburban railway construction over the last 20 years.
The main-line railway tunnels listed in table section B comprise a small number of ongoing construction projects on five railway lines (a total of just over 17 km of tunnels are currently under construction), with a clear focus on the federal state of Baden-Württemberg. Of the total 56 km of tunnels in the large-scale “S21 railway hub” project, around 5 km were still under construction at the time of the survey. A further 8 km of main-line railway tunnels are currently under construction as part of the upgraded/new Karlsruhe–Basel section. Currently, 34% of main-line railway tunnels are being constructed using the classic sprayed concrete construction method, while tunnel boring machines (TBMs) are being used for 43% of the excavation volume (see Fig. 4b).
Road tunnel construction (table section S) has been subject to strong fluctuations in contract awards in recent years, as have the other two transport sectors. This can be deduced from the contract award curves in Figures 5+6. Approximately 51% of the current road tunnel drives with a total length of just under 30 km are being built by underground methods (see Fig. 4c). Sprayed concreting predominates in the majority of cases as far as underground construction projects are concerned
In the V and A sections of the table, relating to supply and disposal tunnels, only those of larger diameter – as initially explained –
are listed. The smallest cross-sections dealt with are roughly 1.0 m in diameter, the largest around 3–4 m. All supply and disposal tunnels recorded at the turn of the year are constructed underground. In the case of waste disposal tunnels, pipe-jacking continues to dominate as it has in previous years. Furthermore, in compiling drain/sewer statistics, it should be pointed out that only major collectors are featured here. The considerably greater part accounted for by drains with smaller cross-section, mostly driven close to the surface by means of cut-and-cover, is not listed here, as this is generally not classified as tunnelling. As part of the intensified expansion of electricity transmission grids, cable tunnels are increasingly being constructed for the underground installation of power lines.
Figure 7 provides details of the regional distribution of ongoing tunnelling projects. With a share of just under 41% of the nationwide volume of transport tunnel construction this year, the Free State of Bavaria is ahead of Baden-Württemberg (approx. 20%).
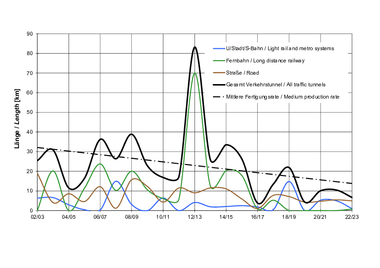
If one compares the newly obtained driven lengths and excavated volumes at the turn of the year for transportation tunnels of recent years, this provides a revealing picture of just how contracts are awarded. In this connection, Figures 5+6 clearly show the important influence of the DB AG’s upgraded/new lines and displays the continuing fickleness on the part of public authorities in awarding new tunnelling contracts. With regard to main-line tunnels, following a steep increase in awarding contracts (mainly on account of the commissioning of “blocks” for the DB upgraded/new lines) the resultant years experienced an equally pronounced dip. The awards curve (Fig. 5) indicates that a minimum level of awards is currently being established again. The annual “production rate” is currently around 21 km/year on a 20-year average. The current 20-year average annual excavation volume is around 2,404 10³m³ (Fig. 6).
2 Planned Tunnelling Projects
(Future Requirements)
The results of the survey relating to confirmed tunnel projects and those due to be awarded in the near future are naturally of special interest to the construction industry and consultants. Table 2 shows the commissioning period starting in 2025.
Examination of the data in Table 2 clearly indicates that the planning volume for transportation tunnels has once again increased significantly.
The total planning volume for underground, urban and rapid transit tunnels remains virtually unchanged from the previous year. Among the listed projects, Hamburg leads the way with almost 40 km of planned tunnelling, ahead of Munich with approximately 25 km. In Leipzig, 7 km are in the preliminary planning stage, and Frankfurt am Main is planning around 6 km of tunnels for regional transport. Further tunnel construction projects, each with a total length of less than 4 km, are planned in the cities of Berlin, Cologne, Düsseldorf, Dortmund and Stuttgart.
The planning volume for main-line railway tunnels has increased again compared to the previous year. The planned tunnelling projects with a total length of over 421 km (previous year: over 404 km) relate to a total of 18 new and upgraded lines. Approximately 65 km of the planned volume is accounted for by the projected upgraded line 36 (“Brenner-Nordzulauf”) and new line Gelnhausen–Fulda. A total of around 50 km of tunnel driving is planned for the new/upgraded Fulda–Gerstungen line. Approximately 47 km of tunnel driving is planned for each of the projects Frankfurt–Mannheim new line and Hannover–Bielefeld new/upgraded line.
The planned volume for road tunnels has fallen slightly compared to the previous year, which is mainly due to contract award effects.
Most of the 149 km of planned road tunnels listed in Table 2 have at least reached the planning approval stage. This applies in particular to tunnels on federal trunk roads, i.e. all projects for which the federal government is responsible.
Technical details relating to the tunnels contained in Table 2 are available from the relevant detailed tables [4]. Essentially, these are structured in the same manner as the statistics on tunnel projects which are in the process of implementation, as presented in section 1. The same approach was selected to identify and differentiate the individual tunnel projects. However, the letter “Z” has been added to make quite clear that the tunnel construction scheme in question is a “future” one. As a consequence, no details are provided concerning the responsible construction companies, as contained in the statistics on current tunnel projects.
Generally speaking, as far as assessing the detailed data relating to future tunnel projects is concerned, it must be observed that alterations can occur during the planning approval and award stages, above all, due to special proposals, relating primarily to the tunnelling method. Various clients have expressly pointed this out. Alterations can, of course, also result with respect to the probable starting and completion dates for projects.
For the construction industry and the consultants, the region in which future tunnel projects are concentrated is of particular interest. The relevant information is presented graphically in Figure 8.
3 Current and Future Tunnel
Modernisation Plans
Extensive partial and complete renovations are planned for a number of old railway tunnels in the coming years. These measures usually require very particular organisational and logistical considerations, especially when they have to be carried out during ongoing railway operations [6]. Examples of complete renovations that have already been carried out include the Frauenberg and Kupferheck Tunnels on the Bingen–Saarbrücken regional line and the Langenau and Hollerich Tunnels on the Wetzlar–Niederlahnstein line near Nassau. These lines went into operation in 1860 and 1862 respectively. In addition to the ongoing complete renovations over a total length of currently around 5 km, a further 82 tunnels with a total length of over 34 km are to be completely renovated and upgraded over the next 20 years. In many cases, a profile expansion is planned in the course of the line electrification.
Road tunnels are also increasingly in need of structural measures, on the one hand to preserve their basic substance and on the other to meet changing operational and safety requirements. This may involve, for example, refurbishment of the inner lining or the subsequent construction of an escape or rescue tunnel [7]. At the time of the survey, approximately 14 km of road tunnels had been structurally renovated or retrofitted with rescue tunnels. The complete renovation of a further 9 km of road tunnels is currently planned. Retrofitting of operational equipment is not included in these statistics.
Details of the ongoing fundamental renovations are compiled in the table section “GS” or “ZGS” for planned fundamental repairs [4].