Tunnelling in Germany: Statistics 2010/2011, Analysis and Outlook
For more than 30 years, the STUVA, in line with a corresponding proposal put forward by the International Tunnelling and Underground Space Association, has compiled statistics on tunnelling activities in Germany [1].
1 Statistics on Tunnels under Construction 2010/2011
As in previous years, the STUVA also undertook a survey of current tunnelling projects in Germany at the turn of the year 2010/2011. The outcome is compiled in tabular form for the month of December 2010 and subsequently assessed. The table follows up its predecessors published for the years 1978 [2] to 2010 [3]. Only tunnels and drain/sewer structures which possess an accessible (walk-in or crawl-in) excavated cross-section, i.e. a clear minimum diameter of 1,000 mm or, including the pipe wall, a minimum cross-section of roughly 1 m2, are listed. On the other hand, small trenchless headings which, in recent years, have frequently been executed in conjunction with main drain construction, the relevant domestic connections, and also pipe-jacking operations beneath rail and road facilities, are not included.
The tunnel projects under construction at the turn of the year 2010/2011 are not listed in detail on account of their extent; however data can be obtained from STUVA’s Internet pages (www.stuva.de). In these tables, the numbering of the tunnel projects indicates the relationship to the data material originating from previous years. Essentially it takes the form of single or double identification letters, a two-digit sequential registration number and a two-digit annual identification number. The identification letters serve to provide a brief assessment of the planned tunnel utilisation, namely:
US Underground railway, urban and rapid transit rail tunnels
B Main-line rail tunnels
S Urban and trunk road tunnels
V Water and other supply tunnels
A Drain/sewer tunnels
So Miscellaneous tunnels
GS Tunnel modernisation
The identification number US 0109 therefore refers to a tunnel project with the sequential number 1 from the Underground, Urban and Rapid Transit Tunnels sector which was included for the first time in the statistics in 2009. The above-mentioned method of identification was selected against the background that the majority of construction sites, especially those from the transportation tunnel sector, run for 2 or 3 years, or even more. This method of registration has proved itself in order to avoid projects being counted twice and to identify the new construction volume that was to be included. Relevant indicators relating to calculation of construction lengths and excavated volumes are accordingly contained in Table 1. In addition to the details for the turn of the year 2010/2011, the figures from the 2 previous years can also be found there for comparison.
By and large, the tunnel lists on the STUVA Internet pages provide information on the location and ultimate utilisation of the tunnels that are included, their length and cross-sections, and also the soil conditions mainly encountered. The construction method used is explained in brief and the scheduled construction time stated. As far as possible, the clients, designers and contractors are named, in alphabetical order. Details of constructional or technical aspects of a special nature are also provided for many projects.
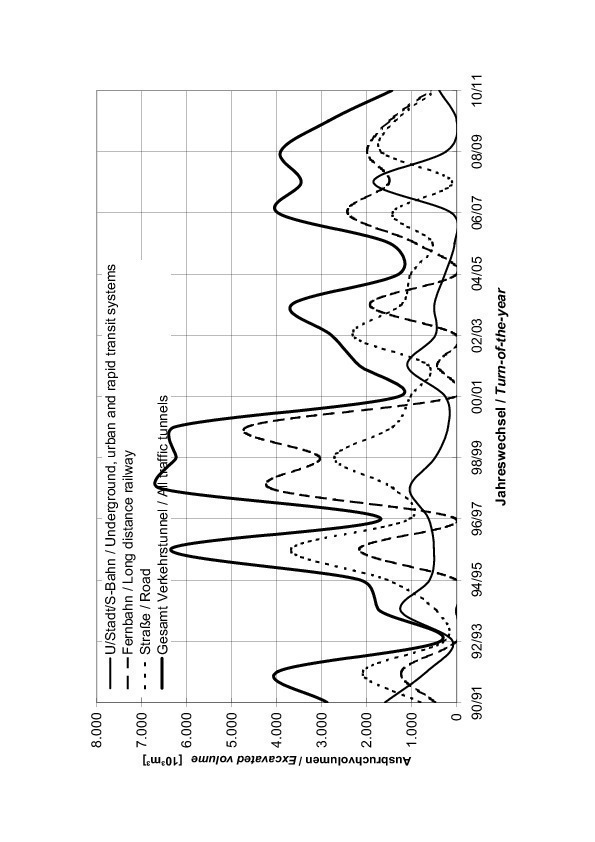
When comparing transportation tunnels with supply and disposal tunnels, information on the excavated volumes of the individual works makes it possible to estimate the actual extent of the relevant measures in a better manner than mere details of lengths. However, the following should be observed when comparing the excavated volume: whereas the excavated volumes for trenchless construction measures can be determined with certainty, the comparative value for cut-and-cover methods can only be obtained by subtracting the amount of soil required for refilling from the total excavated.
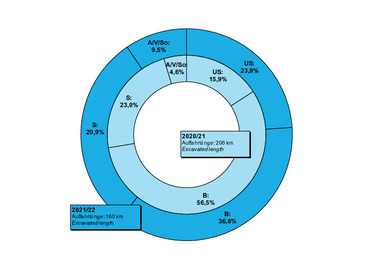
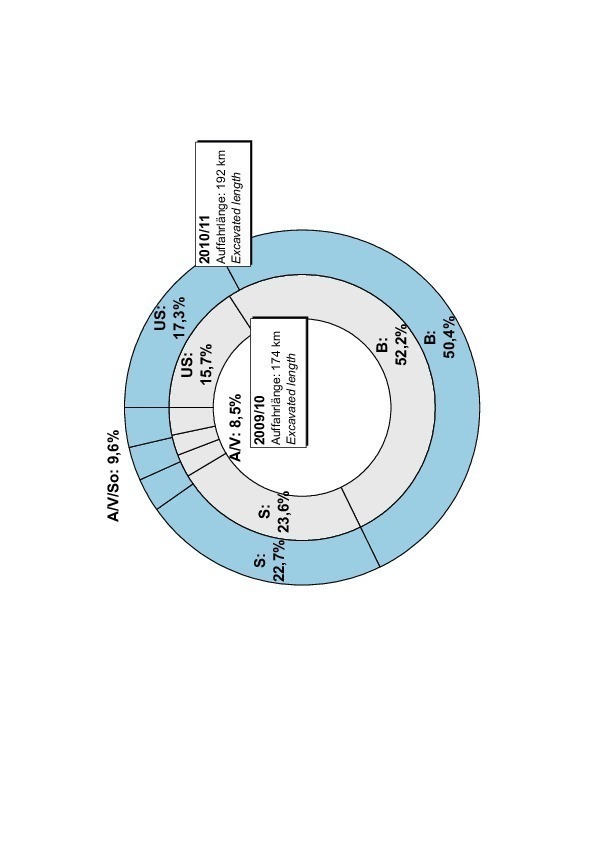
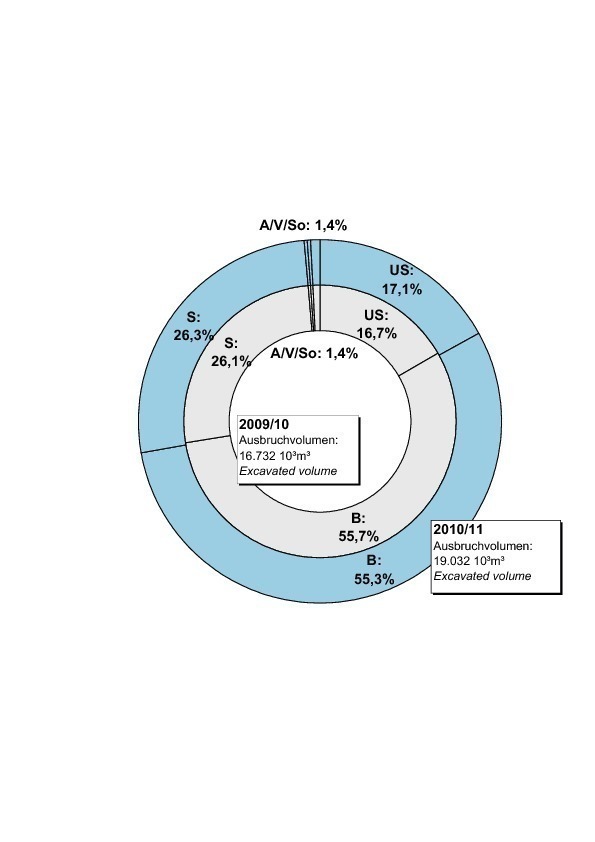
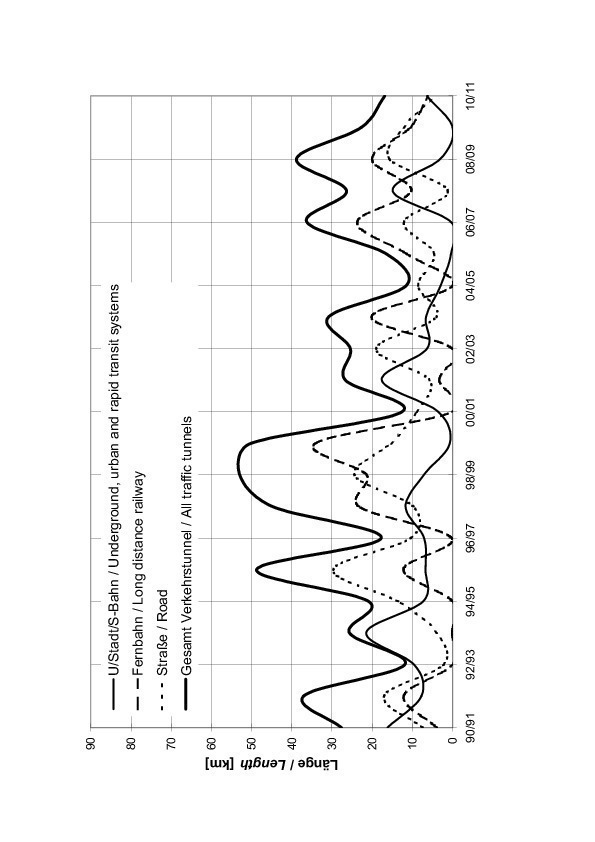
Table 1 provides a picture of the overall tunnelling length under construction at the end of the year in question and the related construction volume. For the turn of the year 2010/2011, Fig. 1 also contains the driven length and the excavation volume in accordance with the type of tunnel utilisation shown in graphic form.
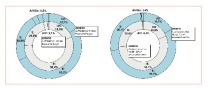
A general comparison of the figures in Table 1 again reveals a clear increase in the driven length of transportation tunnels as at the turn of the year 2010/2011, with a total of almost 174 km compared with some 159 km the previous year. Increase in building activities was generally evenly spread throughout all sectors (Underground, Urban and Rapid Transport, Main-Line Rail and Road).
If one considers the data relating to excavated volume, there is a length-related ratio of almost 9:1 as against a volume-related one of around 71:1 when comparing transportation tunnels on the one hand with supply and disposal facilities on the other (please also see Fig. 1).
The question of the completeness of the data obtained from the survey of construction contractors and consultants is difficult to assess. In order to arrive at greater reliability in this respect, the cities engaged in Underground, Urban and Rapid Transit construction activities, and also Deutsche Bahn AG, were requested to supply data within the scope of the 2010/2011 survey, as was the case in previous years. The Federal Ministry of Transport, Building and Urban Affairs provided data for federal trunk road tunnels [4]. In a large number of cases, the replies from these authorities and from Deutsche Bahn AG resulted in important additions and corrections. At this point, a special word of thanks goes to the Federal Ministry of Transport, Building and Urban Affairs, Deutsche Bahn AG, the other authorities and clients mentioned and the architects and contractors involved, for their assistance in compiling the statistics for current tunnelling projects.
In the following, the results of the survey as of December 2010 are evaluated more thoroughly in various ways in order to obtain an up-to-date overview of tunnelling in Germany. In order to substantiate this, the comprehensive explanatory notes relating to the structures to be found in ”Underground Construction in Germany 2010”, containing a large number of examples presented in both illustrated and written form are referred to [5].
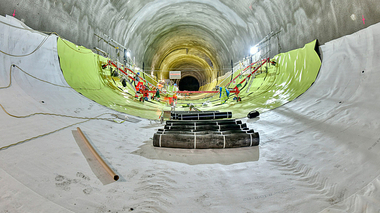
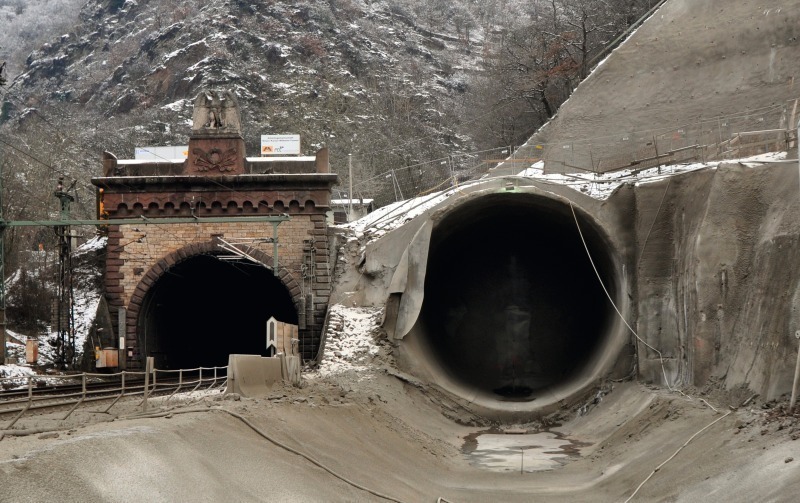
• This year, the main activities relating to inner-urban rail tunnelling (Table section US) took place in Cologne (Fig. 2), where a total of just on 6.8 km of Underground and Rapid Transit tunnels was under construction at the turn of the year 2010/2011. Currently around 6.6 km of Underground Railway tunnels are under construction in Hamburg. Further tunnel projects are underway in Berlin (5.7 km), Stuttgart (3.4), Düsseldorf (3.3 km), Munich (3.2 km), Karlsruhe (2.9) and Nuremberg (1.4 km).
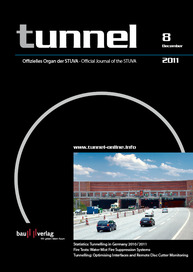
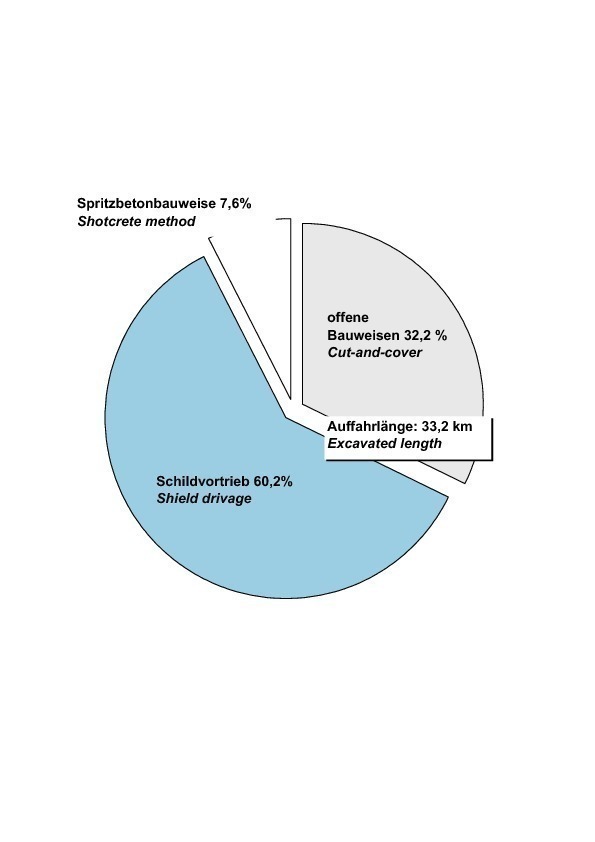
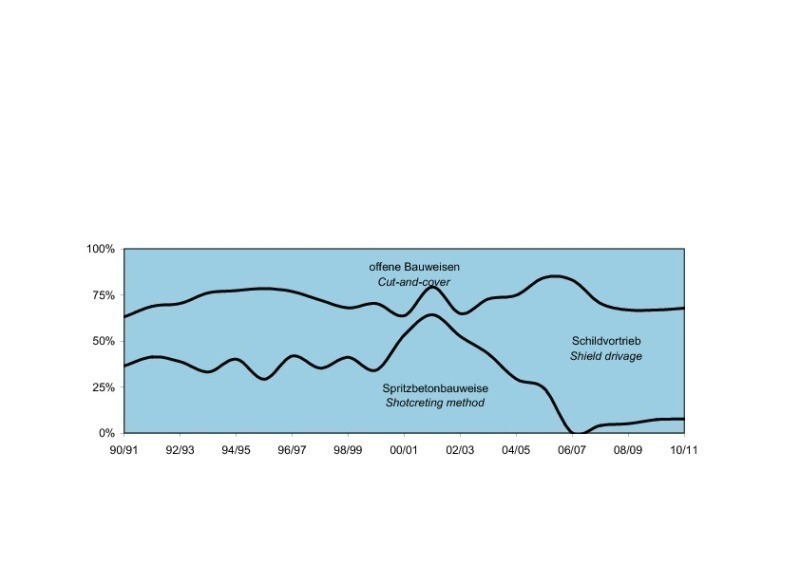
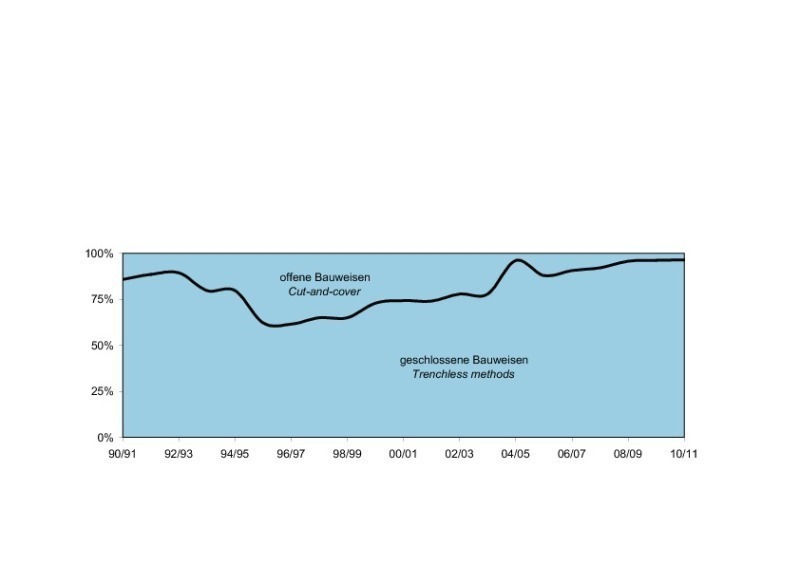
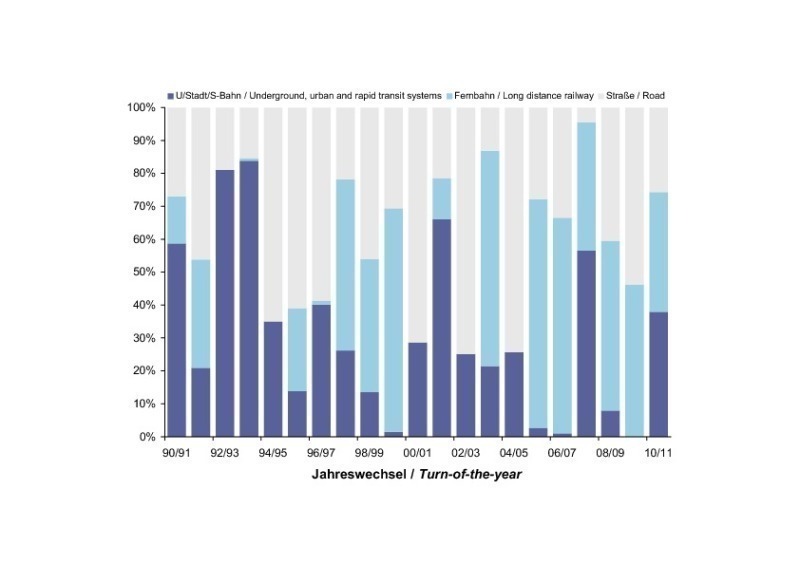
• The length-related proportion of trenchless construction methods with regard to inner-urban rail tunnel construction amounted to 22.5 km at the end of 2010, accounting for approx. 68 % of the total national construction volume for Underground Railway, Urban and Rapid Transit rail systems. Of this total, some 8 % was accounted for by shotcreting methods (7 % the previous year) and roughly 60 % as in the previous year by shield driving. Fig. 3a provides a survey of the percentages accounted for by the various tunnelling methods. In this context, the diagram in Fig. 4a shows the length-related proportion of trenchless construction methods in Underground Railway, Urban and Rapid Transit rail construction during the last 20 years. In this diagram, the division of trenchless construction methods into shotcreting and shield drive work is featured.
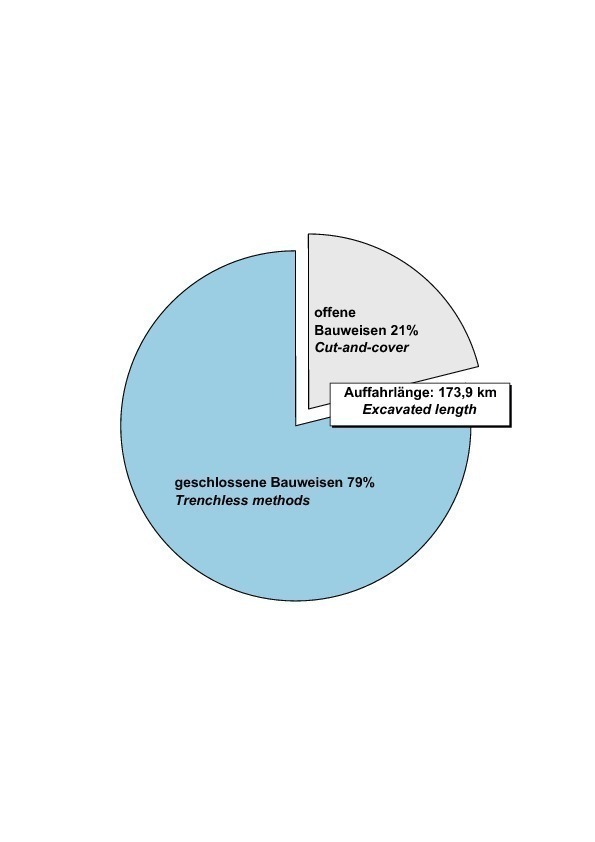
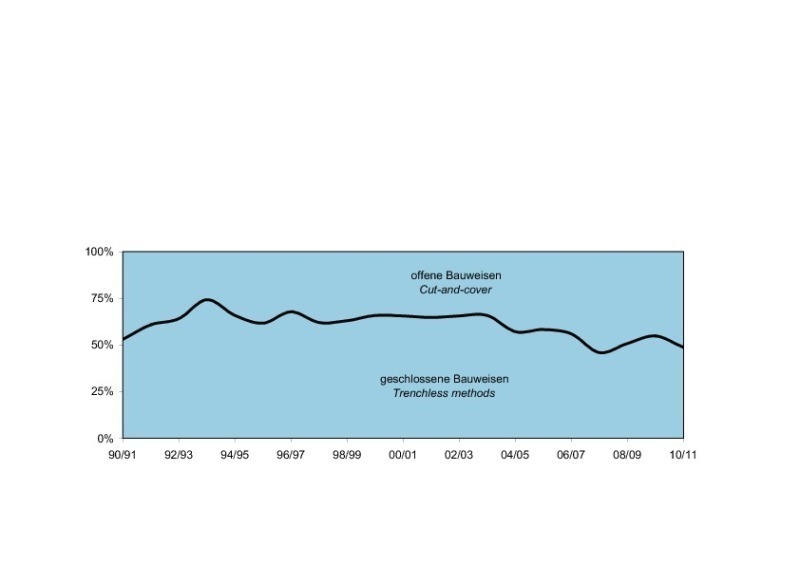
• The main-line rail tunnels listed in Part B largely relate to works in conjunction with the new-line and upgrading programme for Deutsche Bahn AG‘s high-speed routes. Of the tunnelling projects currently being implemented (a total of 97 km), almost 37 km is accounted for by the new Nuremberg to Erfurt and some 31 km by the Erfurt to Halle/Leipzig lines. Some 19 km of main-line rail tunnels are under construction on the Karlsruhe – Basle upgrading/new line section. These main-line rail tunnel projects predominantly employ underground („trenchless“) tunnelling (Fig. 4b), 61 % using shotcreting and 35 % mechanised methods (Fig. 2).
• Road tunnel construction (Part S of the table), like the two other transportation tunnel sectors, has constantly been subject to pronounced fluctuations in contracting in recent years. This becomes clearly evident from the award curve in Fig. 5 and above all, from the curve pertaining to the award and length-related percentages in Fig. 6. Road tunnels related to their lengths are driven both by mining means and by cut-and-cover in roughly equal proportions. In this connection, shotcreting together with drill + blast predominate in the majority of cases as far as trenchless projects are concerned (please see Fig. 4c). As far as trenchless construction methods are concerned shotcreting in conjunction with drill+blast dominates in the majority of cases.
In the V and A sections of the table, relating to supply and disposal tunnels, only those of larger diameter – as initially explained – are listed. The smallest cross-sections dealt with are roughly 1.0 m in diameter, the largest around 3–4 m. All the supply and disposal tunnels assessed at the turn of the year are driven by trenchless means. In the case of waste disposal tunnels, pipe-jacking continues to prevail as it has in previous years. Furthermore, in compiling drain/sewer statistics, it should be pointed out that only main drains are included here. The considerably greater part accounted for by drains of smaller cross-section, mostly driven close to the surface by means of cut-and-cover, is not listed here, as this is generally not classified as tunnelling.
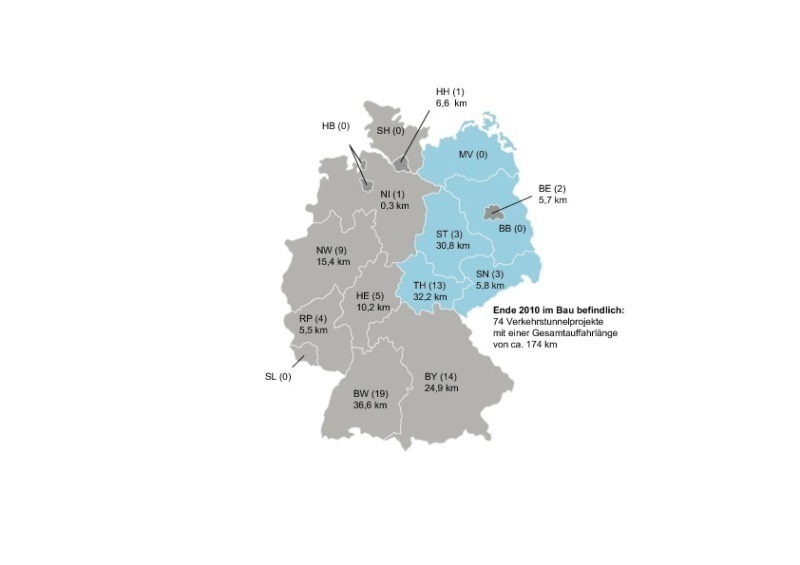
The distribution by federal states (Länder) of the tunnels under construction at the end of 2010 is also of interest. Table 3 and Fig. 7 provide more details of this.
If one compares the newly obtained driven lengths and excavated volumes for the turn of the year for transportation tunnels based on the statistics of recent years, then a revealing picture of just how contracts are awarded is obtained. In this connection, Fig. 5 clearly shows the important influence of the DB’s new lines and displays the continuing fickleness on the part of public authorities in awarding new tunnelling contracts, a fact which constantly gives rise to complaints by the construction industry and consultants. After a steep rise in awards from 1996 to 2000 (resulting above all from activity in conjunction with the new Cologne – Rhine/Main route), an equally steep downturn then set in for the next 2 to 3 years (Fig. 6). As a consequence, as far as providing work for the available capacities in the tunnelling industry (design and execution) is concerned, expectations are still concentrated on engineering works in conjunction with further new and upgraded lines for Deutsche Bahn AG, and also in the national trunk roads sector ( please refer to Chapter 2).
2 Planned Tunnelling Projects
The results of the survey relating to confirmed tunnel projects and those due to be awarded in the near future are naturally of special interest to the construction industry and consultants. Table 2 shows the award period starting in 2011.
Examination of the data in Table 2 clearly indicates that the greater planning volume for Underground, Urban and Rapid Transit rail tunnels, registered the previous year has practically “normalised”, i.e., the state has awarded an increasing amount of projects (please also see Table 1). In this context, the remaining planned volume for the city of Munich, comprising just on 22 km, is conspicuous. A good 6 km of tunnel is planned for Stuttgart, in conjunction with the Stuttgart 21 project. Further tunnel construction, up to roughly 3 km in each case, is scheduled for Augsburg, Cologne, Dortmund, Düsseldorf, Duisburg, Frankfurt/Main, Hamburg and Nuremberg.
Regarding the particularly high proportion of main-line rail tunnels, it should be noted that this is principally the result of the high tunnel content of the new Wendlingen – Ulm line, with a good 58 km, the Stuttgart 21 main-line project (around 57 km) and the Nuremberg – Erfurt upgrading/new line project (around 12 km).
Furthermore, the unaltered high volume of projected road tunnels remains conspicuous. More than 90% of the projects listed are in the old (western) federal states of Germany (please refer to Table 4). The measures that are being planned in the new (eastern) federal states are mainly at the preliminary planning stage and are consequently not yet sufficiently advanced to be included in the statistics. The planning in this sector is primarily being carried out in conjunction with „German Unity Projects – Road”.
The 173 km of planned road tunnels listed in Table 2 has at least generally reached the planning approval stage. This applies principally to the tunnels on federal trunk roads, i.e. those for whose construction the federal government is responsible (no figures are available for the federal states and municipalities). Further road tunnels totalling almost 80 km in length are also under consideration, and these must be added to the figures shown in Table 2. For a number of these projects, the environmental impact assessment (EIA) has already been concluded or the route alignment has been finalised. Their implementation is not yet totally certain, however, either in terms of scheduling or financing.
Technical details relating to the planned tunnels included in Table 2 can be found in the relevant tables (available from http://www.stuva.de/tunnelbau-bautechnik/tunnelstatistik.html). Essentially, these are structured in the same manner as the statistics on tunnel projects which are in the process of implementation, as presented in Section 1. The same approach was selected to identify and differentiate the individual tunnel projects. However, the letter “Z” has been added to make quite clear that the tunnel construction measure in question is a “future” one. As a consequence, no details are provided concerning the responsible construction company or consortium, whereas these can be found in the statistics on current tunnel projects.
Generally speaking, as far as assessing the detailed data relating to future tunnel projects is concerned, it must be observed that alterations can occur during the planning approval and award stages, above all, due to special proposals, relating primarily to the tunnelling method. Various project clients expressly pointed this out. Alterations can of course, also result with respect to project starting and completion dates.
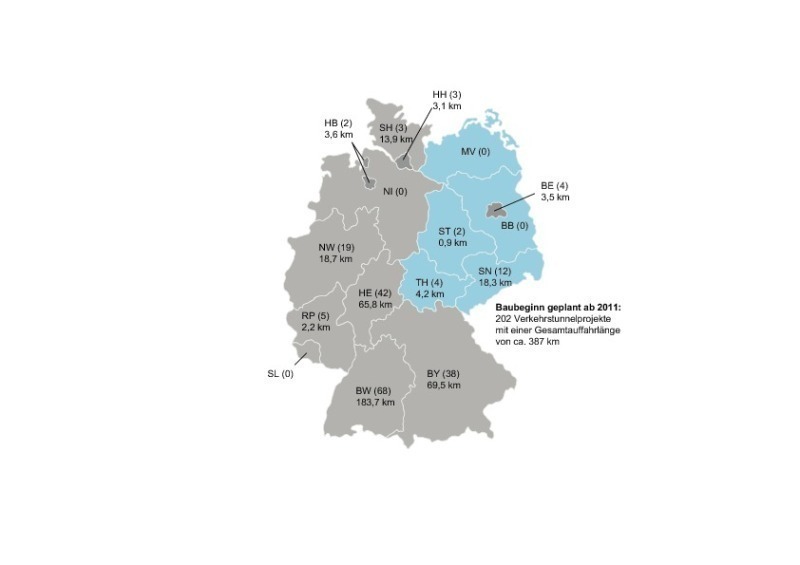
It is also of interest for the construction industry and the consultants involved to be aware of the regions for which implementation of the planned tunnel projects is mainly scheduled. Table 4 and Fig. 8 show the relevant details, categorised by federal state.
3 Tunnel Modernisation Plans
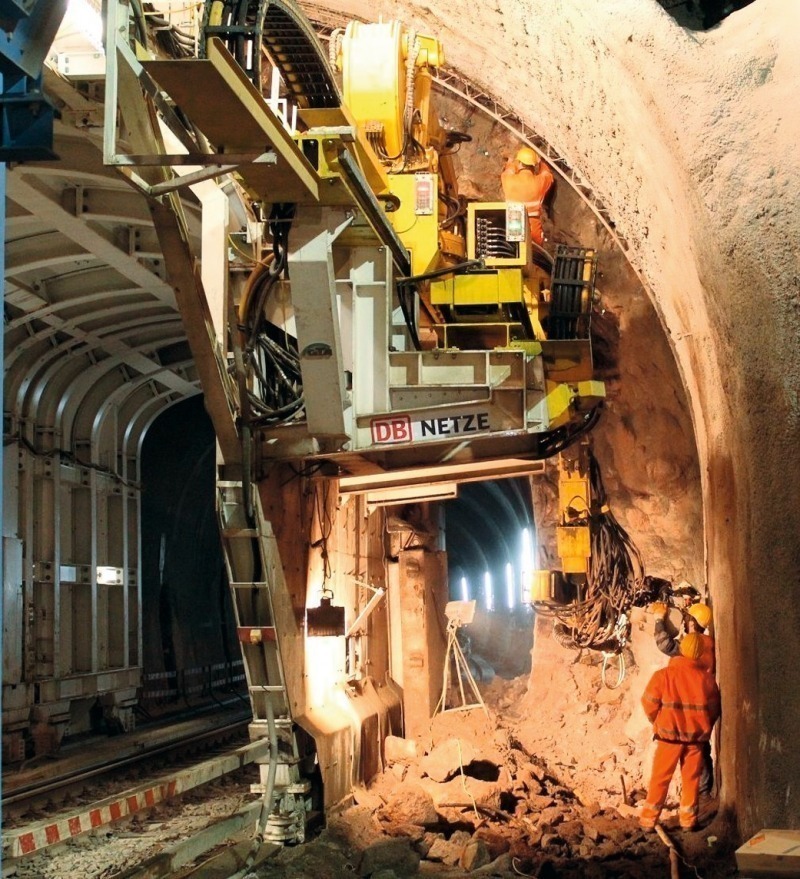
To an increasing extent, partial and complete refurbishing schemes are now being scheduled for existing rail tunnels. Generally speaking, such measures call for special organisational and logistical provisions, particularly if these projects are to be implemented without causing disruption to rail traffic (Fig. 9). Recent examples of this are provided by the enlargement of the cross-sections of two rail tunnels, which have now been completed, i.e., the Jährodt and Mausemühlen tunnels as well as the renovation of the Frauenberg and Kupferheck tunnels on the Nahe valley line between Bingen and Saarbrücken, a route which opened to traffic in 1860. In the near future, comprehensive modernisation and/or –cross-sectional enlargement of no less than 20 km of tunnel is scheduled. Table Section “ZGS” contains the relevant details. The identification and description of the individual projects correspond to the future new construction projects found in Table 2.