Risk Management in Major Tunnelling Projects – Part 1: Basics and Success Factors
Effective cost and risk management is critical to the success of large infrastructure projects. Significant cost overruns in major projects show that risk management is not being given the importance it should have. In order to be able to measure and control current cost and the schedule against set targets, it is necessary to assess risks in a transparent manner and to consider them appropriately. The insight is not new – every reader will certainly have heard this or similar statements. But why do we get the impression that nothing changes and that we – paraphrasing Einstein – do the same thing over and over again and still expect different results?
1 Introduction
In Germany, the Reform Commission on the Construction of Major Projects already presented its final report in 2015 [1]. A central recommendation is the implementation of systematic risk management for project execution.
The German Federal Ministry of Transport and Digital Infrastructure (BMVI) has taken up the recommendations of the Reform Commission for road construction and initiated the research project „Support for the implementation of risk management in pilot projects in the field of federal trunk roads”. Other partners are the infrastructure project management agency DEGES GmbH, the Bavarian State Ministry of Housing, Construction and Transport, and independent industry experts. The results are promising, as the pilot projects show a stable as well as transparent cost development.
This article is the first in a three-part series dealing specifically with the implementation of risk management for large-scale tunnelling projects and also incorporating the results from the BMVI‘s research project.
On this basis, the research project „Centre for Digitisation and Technology Research of the Bundeswehr“ (dtec.bw)
started in January 2021. Through this funding, the DigiPeC
(Digital Performance Contracting Competence Center) project was launched. The project aims to create a
competence centre for incentive-based contracts and risk-based management of complex procurement projects for public clients.
In connection with the concept of risk management, the common standards ISO 31000 and DIN EN 31010 are often referred to. However, these standards are not a guideline, but merely set out relevant basic terms and process steps. This Part 1 of the article series therefore explains the basics for an application, especially for large projects, beyond the definitions of the standards.
Part 2 will show an example of the structure of an integrated cost, risk and construction time model. This integral model is the basis for a digital twin of a project in terms of cost and schedule planning.
Part 3 explains the central role of risk management in incentive-based project delivery and contract models.
The following chapters explain the basics for the successful implementation of risk management in large-scale tunnelling projects.
2 Consideration of Uncertainties
We assume that the reader is familiar with the basic concepts of risk, risk management and the use of probabilistic methods.
The basis for a risk analysis is the estimation of the probability of occurrence and the scope of possible damage. In case of complex interrelationships – as they often occur in large-scale projects – lean construction [2] can be used as a means of reducing complexity and determining interdependencies. With a production flow-oriented approach, the production process can be made much more transparent and controlled more effectively. In parts
2 and 3, the authors will address these topics in more detail.
Compared to the simpler deterministic approach, the probabilistic approach provides an aggregated distribution function and thus valuable information with regard to the deviation in terms of cost and schedule, both in a negative direction (threats) and in a positive direction (opportunities). In this way, risks that affect meeting objectives can be more easily assessed and identified in order to take timely countermeasures [3] [4]. The use of probabilistic methods is recommended for the implementation of risk management in large-scale projects.
The main advantages of using probabilistic methods are outlined below [5]:
Consideration of uncertainties by specifying ranges instead of exact figures. In this way, uncertainties can be taken into account transparently and displayed as a basis for decisions.
Due to the predictive character, the indication of ranges is more accurate than the indication of exact figures.
The independent variables “probability of occurrence” and “impact” (extent of damage) are not mixed, and the information is not lost in the course of aggregation.
For the probabilistically determined risks, a P-value can be selected for budgeting, which indicates the probability of exceeding or undercutting the associated cost.
3 Predictive Character
The aim of predictions is to depict the future as accurately as possible with regard to defined aspects. However, predictions are always subject to uncertainties. The common approach describes that the range of prediction uncertainty decreases more and more as project knowledge improves in the different project phases.
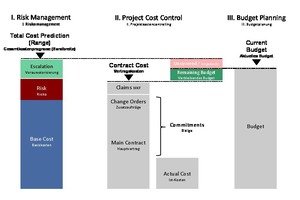
The risk management approach provides a probabilistic total cost prediction at a fixed date with transparent reporting of uncertainties. This prediction is used to validate the budget (Fig. 1).
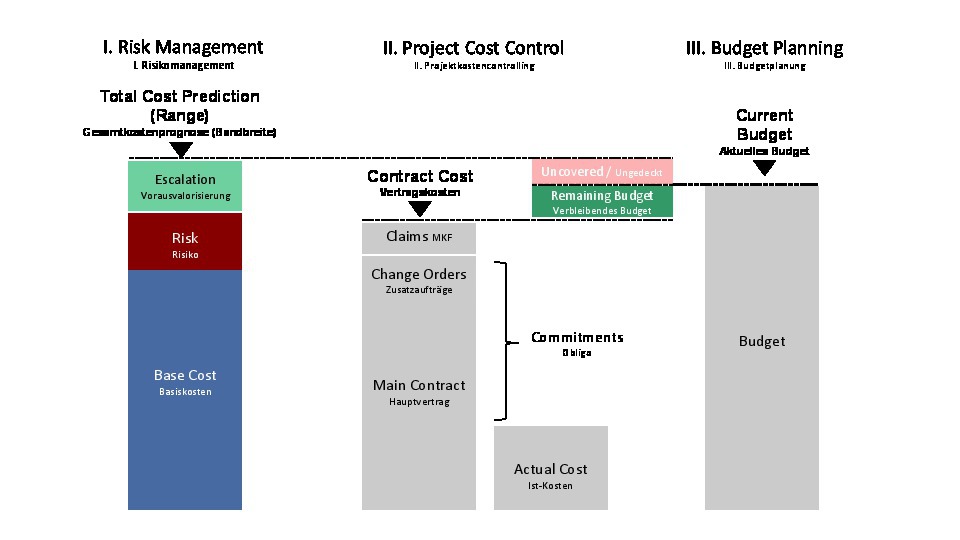 1 | Interaction of RM, project cost control and budget planning
Credit/Quelle: RiskConsult GmbH
A budget does not usually describe the cost of a project. Rather, it is a fixed amount of money that is allocated to realise a project. The budget and the realistic cost of a project can differ greatly. Developing a cost prediction purely on the basis of a budget is not an accurate approach.
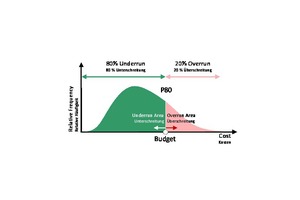
In Fig. 2 the budget is compared to the risk management prediction (distribution for cost). This shows a probability of 80% (P80) that the budget will be underrun. Conversely, there is a 20% probability that the budget will be overrun.
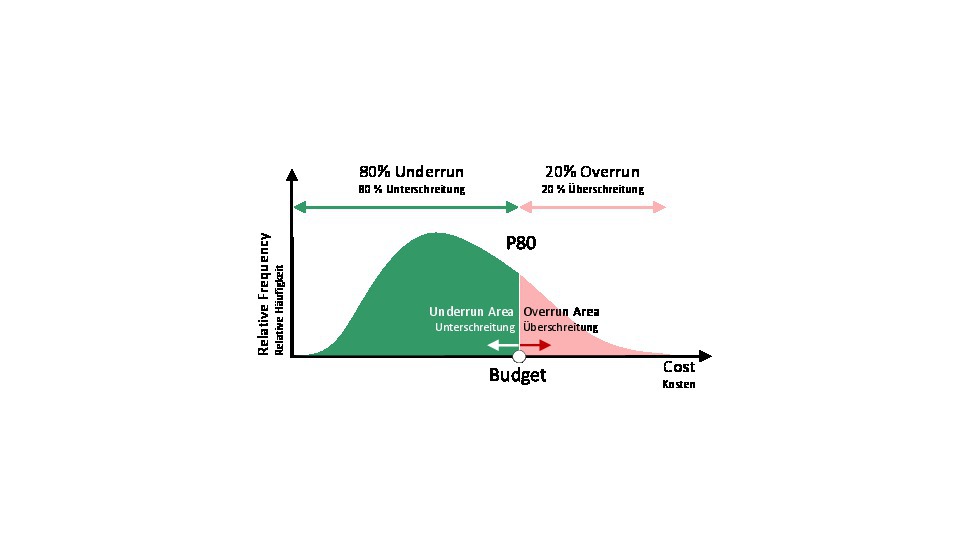 2 | Validation of a budget (here P80)
Credit/Quelle: RiskConsult GmbH
The P-value – or value at risk – indicates a value (e.g. 1.0 million euros) within a probability distribution that will not be exceeded or underrun with an assigned probability (overrun or underrun probability).
4 Cost Components
The use of cost components that build on each other aims to create cost transparency by specifying a clear cost structure that can be applied from an early planning stage to construction completion. The main cost components are:
Base cost: Cost if „everything goes according to plan“, without reserves for risks or approaches for escalation (price increase).
Risk: Cost resulting from threats and opportunities that can occur but are not certain to occur (probability of occurrence).
Escalation: Cost resulting from the forecast price increase
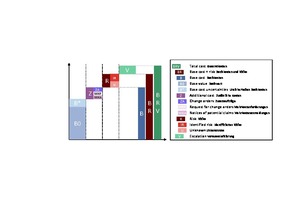
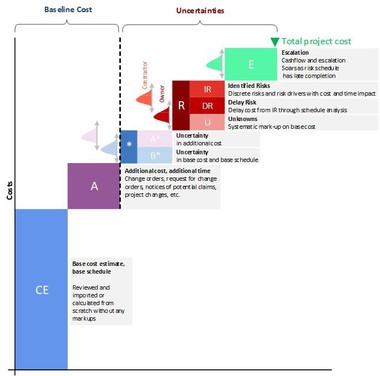
Base cost are further divided into the base value (B0), which is composed of the basic cost estimate plus the base cost uncertainties (B*) for quantity and price estimates in the planning phase. Furthermore, the additional cost (Z) are included. These comprise all cost changes during the execution of the project, i.e. change orders (ZA), requests for change orders (MKF) and notices of potential claims (MKA).
Risk consist of the identified risks (IR) and the unknown (U). BR denotes the sum of base cost and risk. The total cost additionally include escalation (V) and form the sum BRV. Fig. 3 shows the cost components in the representation of a waterfall chart.
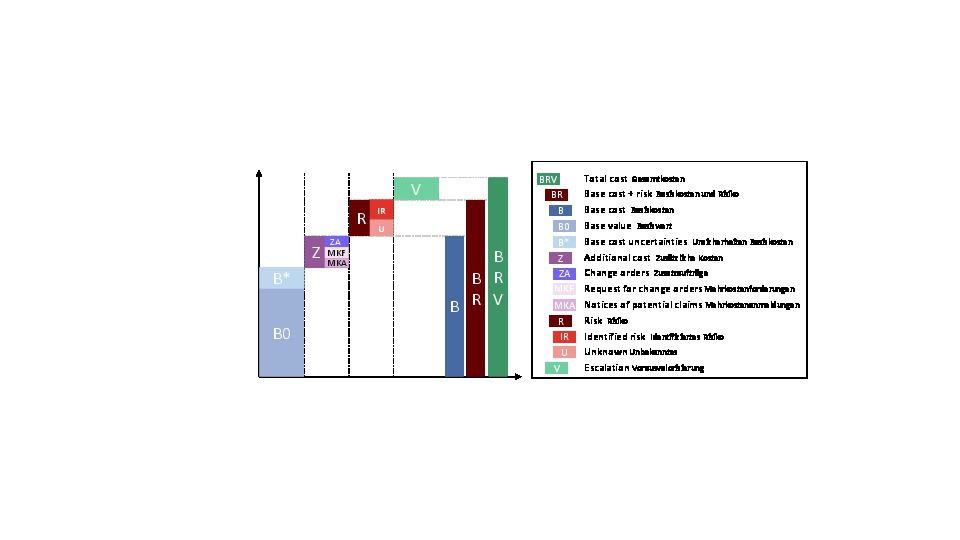 3 | Sample of a cost component structure
Credit/Quelle: RiskConsult GmbH
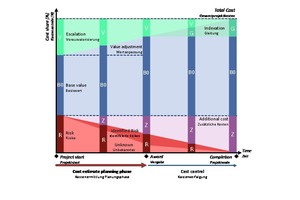
Fig. 4 shows the same cost component structure over the course of the project [6]. During the planning phase, there is usually a high risk potential, but no additional costs yet, which are the result of risks that have occurred. In addition, the predicted cost for escalation are set depending on the construction period (e.g. one year or ten years).
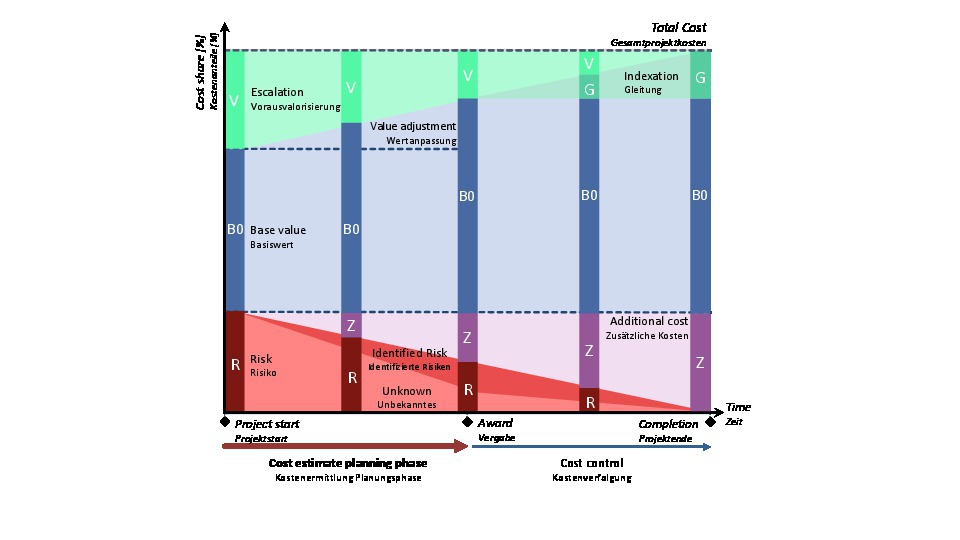 4 | Idealised representation of the cost components in the course of the project
Credit/Quelle: RiskConsult GmbH/ÖGG
In the course of the construction phase, the risk potential is reduced; in turn, additional cost are incurred. The escalation decreases as the end of the project comes closer. After conclusion of the contract – if indexation clauses have been agreed – indexation cost occur (realised escalation) [7].
With completion, there are no more uncertainties. The actual cost consist only of the base costs (B = B0 + Z) and the indexation G.
5 Integral Modelling of Cost,
Deadlines and Risks
The integrated cost and construction time model is an essential part of risk management. Here, the information from cost management, risk management and scheduling is bundled and linked together. The model is an important element of a digital twin of the project for cost and schedule. It enables further analysis options (e.g. what-if) at the management level.
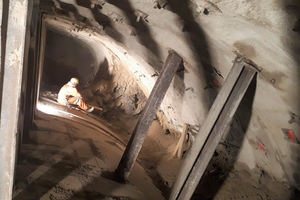
The integration of scheduling into risk management is extremely relevant here, since deadlines that are not met – as many examples in major projects show – are often the cause of massive cost overruns. Another tool is the approach of lean construction. With the help of lean construction, work processes can be evaluated and analysed, and risks can be identified at an early stage. Especially in tunnelling, events such as the jamming of a TBM (Fig. 5) can lead to massive time and thus also financial losses.
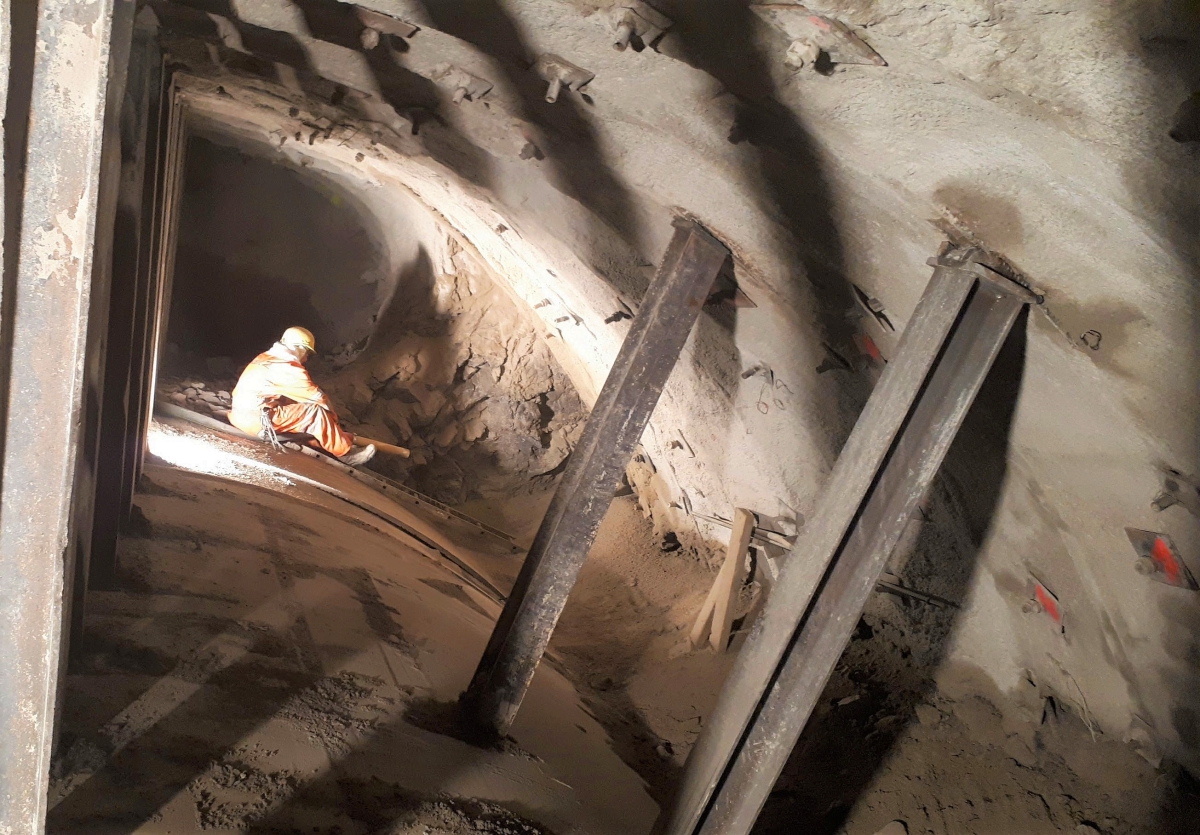 5 | Example of a major delaying incident in tunnel construction : A jammed TBM must be made operational again
Credit/Quelle: Philip Sander
The approaches of cost and time are fundamentally different, but correlate with each other. If money is not spent, it remains in the budget or bank account and can be used at a later date as needed. If time, on the other hand, is not used efficiently, it is wasted and lost forever. In this sense, time cannot be controlled. This property of time – due to the interdependence of money and time – is often transferred to the flow of money in large projects. Efficient construction time management cannot be achieved by measuring performance or contractually stipulating penalties alone. The predictive nature of construction scheduling must be taken into account in the analysis. The value of a schedule therefore lies not only in the control of construction time; it has a higher priority.
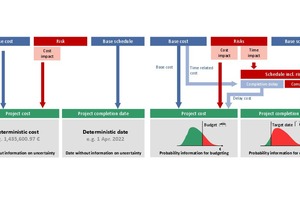
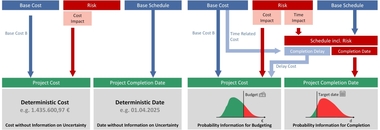
The conventional approach in project management (Fig. 6, left) of considering cost, risks and scheduling as independent does not take into account the dependency between time and cost. In addition, predicted values are often used as a basis for decisions without any
information on uncertainties, which in reality are close to zero.
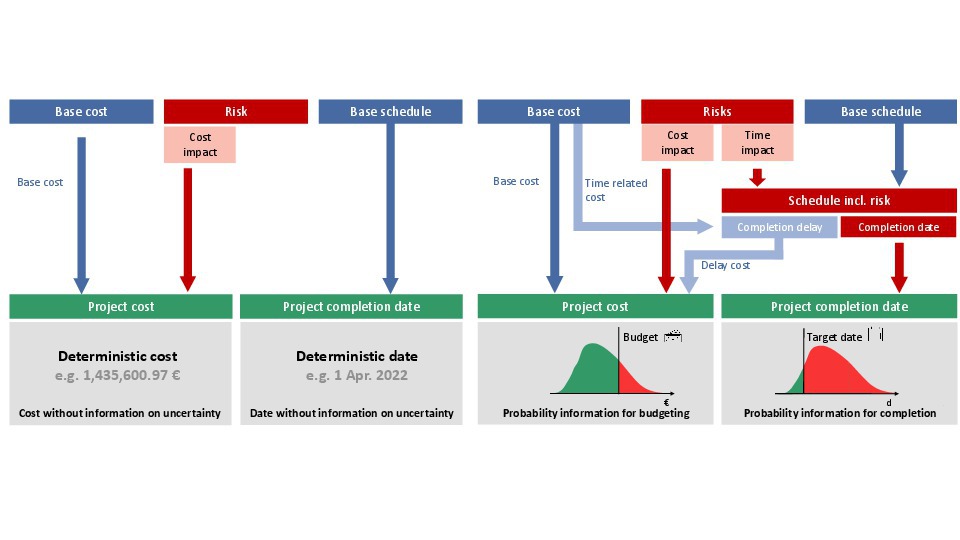 6 | Left: Standard project management approach; right: Integrated cost, risk and schedule model
Credit/Quelle: RiskConsult GmbH
The integral model (Fig. 6, right) links risks that affect construction time with the processes of the construction schedule to determine the completion date, construction delays and potentially critical paths, taking into account the identified risk scenarios. The result of the construction time simulation (deviation from target date) is incorporated into the work breakdown structure and linked to time-related cost. In this way, the costs from construction time delays are taken into account in the overall result [8].
6 Results
6.1 Cost
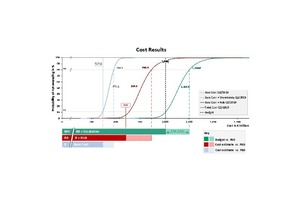
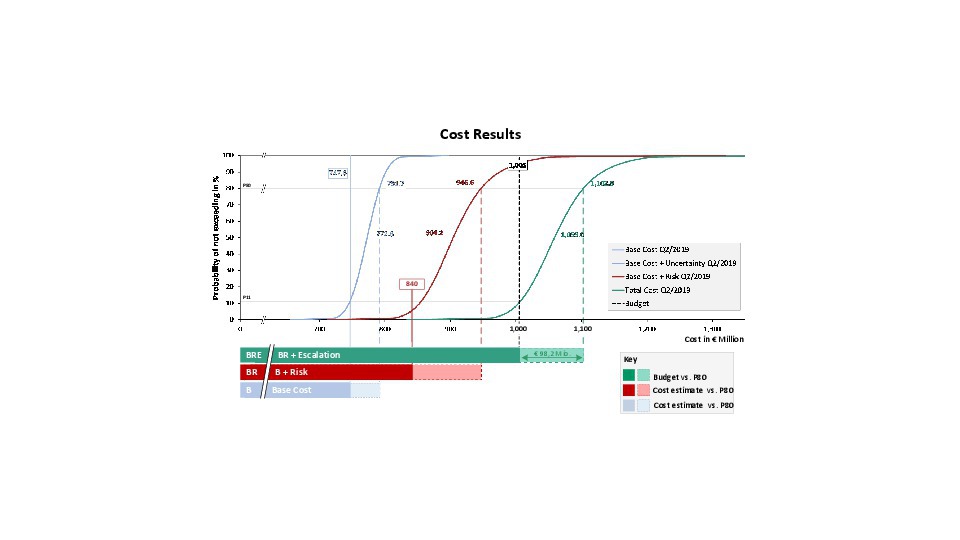
The total project cost including their uncertainties are determined by simulation from the basic cost, the risks and the escalation. The result of the analysis is shown by means of s-curves broken down into cost components (Fig. 7).
 7 | Total cost broken down into cost components with uncertainties and budget comparison
Credit/Quelle: RiskConsult GmbH
Starting from the deterministic base cost (747.6 million euros in the example), the blue curve shows the base cost including quantity and price uncertainties. The risks (red curve) and the cost estimates for escalation are added to this (green curve).
The result is compared to the budget. In the example, the budget of 1005 million euros corresponds to the P10 value,
i.e. the budget is underrun by 10% and overrun by 90%. In order to achieve a budget certainty of 80%, the budget would have to be increased by 98.2 million euros.
6.2 Schedule
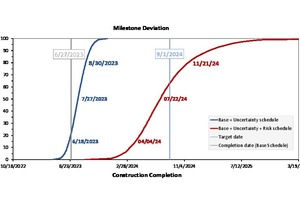
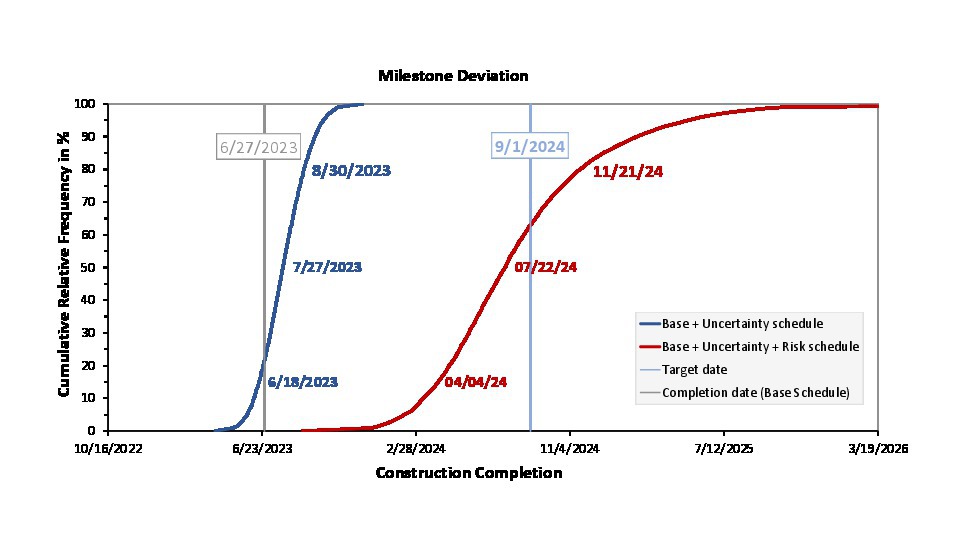
The evaluation of the completion date (milestones) results in a systematically similar S-curve diagram to the one for cost. The blue curve in the example in Fig. 8 shows the base schedule incl. uncertainties.
 8 | Evaluation of milestones
Credit/Quelle: RiskConsult GmbH
The red curve is the result of adding identified risks (IR) with deadline impact. The comparison with the target date (in the example 1 September 2024) results in a schedule certainty of approx. 65% (P65). The comparison with the target date (in the example 1 September 2024) results in a schedule certainty of approx. 65% (P65). The target date can be maintained with a probability of 65% on the current key date. It will be exceeded with a probability of 35%. In order to achieve an 80 % certainty (P80) of the target date according to the current status, 21 November 2024 should be envisaged as the target date.
7 Outlook
The second part of the article series „Risk Management in Major Tunnelling Projects“ continues the basic principles described in the first part and explains the structure of a digital project twin for cost and construction time analysis, using the example of a major tunnelling project.
With the DigiPeC research project at the University of the Bundeswehr Munich, incentive-based contracts are
intended to promote cooperative working between clients and construction companies. A central element for success is risk management, the implementation and
application of which will be described in more detail in the next two parts of this article series.

